

Foliar Fungicide Impact on Soybean Yield in 2023
go.ncsu.edu/readext?984463
en Español / em Português
El inglés es el idioma de control de esta página. En la medida en que haya algún conflicto entre la traducción al inglés y la traducción, el inglés prevalece.
Al hacer clic en el enlace de traducción se activa un servicio de traducción gratuito para convertir la página al español. Al igual que con cualquier traducción por Internet, la conversión no es sensible al contexto y puede que no traduzca el texto en su significado original. NC State Extension no garantiza la exactitud del texto traducido. Por favor, tenga en cuenta que algunas aplicaciones y/o servicios pueden no funcionar como se espera cuando se traducen.
Português
Inglês é o idioma de controle desta página. Na medida que haja algum conflito entre o texto original em Inglês e a tradução, o Inglês prevalece.
Ao clicar no link de tradução, um serviço gratuito de tradução será ativado para converter a página para o Português. Como em qualquer tradução pela internet, a conversão não é sensivel ao contexto e pode não ocorrer a tradução para o significado orginal. O serviço de Extensão da Carolina do Norte (NC State Extension) não garante a exatidão do texto traduzido. Por favor, observe que algumas funções ou serviços podem não funcionar como esperado após a tradução.
English
English is the controlling language of this page. To the extent there is any conflict between the English text and the translation, English controls.
Clicking on the translation link activates a free translation service to convert the page to Spanish. As with any Internet translation, the conversion is not context-sensitive and may not translate the text to its original meaning. NC State Extension does not guarantee the accuracy of the translated text. Please note that some applications and/or services may not function as expected when translated.
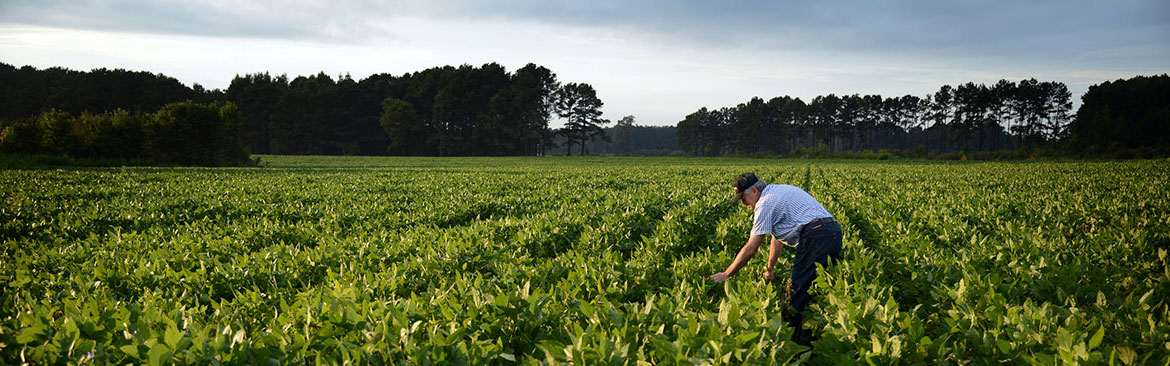
Collapse ▲The NC State Soybean Extension and Pathology programs conducted foliar fungicide trials across North Carolina in 2023. Field trials were located in Sampson, Union, and Yadkin counties (Figure 1) and the trials included seven different fungicide products applied at R3 with various fungicide products plus a nontreated control as a check (Table 1). A soybean variety that was moderately susceptible to frogeye leaf spot was used across locations.
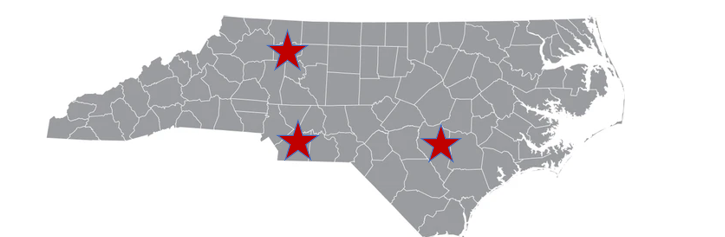
Figure 1. 2023 Foliar Fungicide Trial Locations.
Table 1. Fungicide Products, Active Ingredients, and Fungicide Resistance Action Committee (FRAC) Code.
| Fungicide | Chemistry (Active Ingredients) | FRAC Code |
| Delaro | Prothioconazole + Trifloxystrobin | 3 + 11 |
| Delaro Complete | Prothioconazole + Trifloxystrobin + Fluopyram | 3 + 11 + 7 |
| Lucento | Bixafen + Flutriafol | 7 +3 |
| Miravis Top | Pydiflumetofen + Difenoconazole | 7 + 3 |
| Revylok | Mefentrifluconazole + Fluxapyroxad | 3 + 7 |
| Revytek | Mefentrifluconazole + Fluxapyroxad + Pyraclostrobin | 3 + 7 + 11 |
| Stratego Yield | Prothioconazole + Trifloxystrobin | 3 + 11 |
| NTC | – | – |
Weather conditions and disease pressure varied across the locations. Generally, for infection and reproduction most pathogens favor a high relative humidity (>80%), warm temperatures (75-85 F), and are dispersed within and across fields from wind and rain splash.
These weather conditions were collected for each location from July 1, 2023 to August 30, 2023 to capture environments that may be favorable for diseases before and after fungicide applications occurred. Sampson and Yadkin both had a higher and more consistent relative humidity compared to Union (Figure 2). Though Sampson and Union experienced higher temperatures than Yadkin (Figure 3). Sampson also had the highest amount of rainfall compared to the other two locations (Figures 4 and 5). A disease can only occur if it has the three components; a susceptible host, a conducive environment, and the fungal organism causing the disease must be present. Without these three points, disease will not be observed, however the factors within each of these components can influence the risk and pressure of disease that we may see. For example, if a resistant variety has been planted, we may still see disease as the host may not be completely resistant. The same is true for the environmental components influencing disease pressure and this was observed based on the weather data collected. Sampson county was the only location with all three factors favorable for disease development.
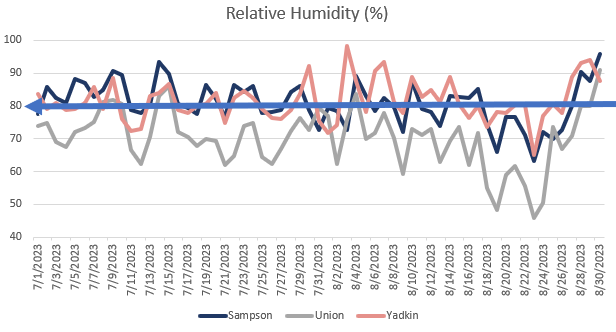
Figure 2. Relative Humidity (%) at each location from July 1st to August 30th with an arrow pointing to the percent that begins to have favorable disease risk conditions.
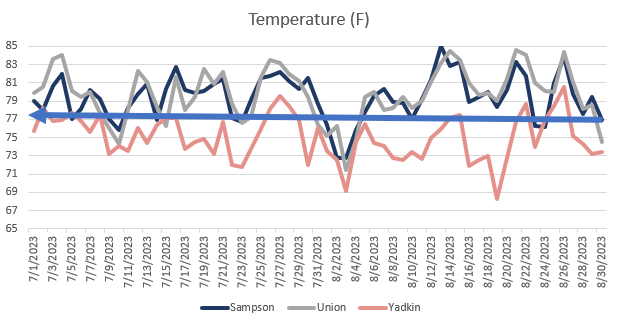
Figure 3. Temperature (F) at each location from July 1st to August 30th with an arrow pointing to the temperature that is favorable for disease.
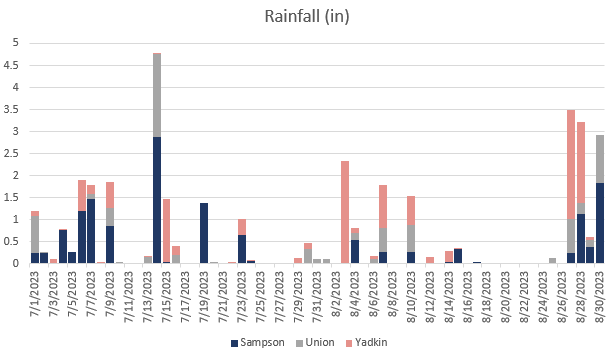
Figure 4. Rainfall (in) at each location from July 1st to August 30th.
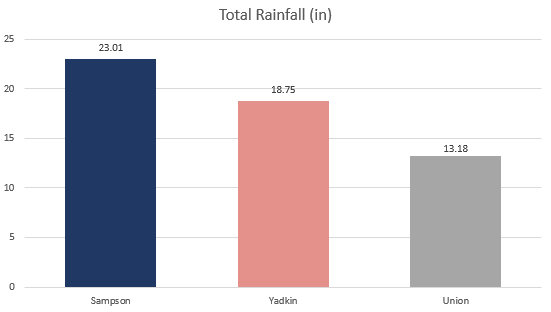
Figure 5. Total Rainfall (in) at each location from July 1st to August 30th.
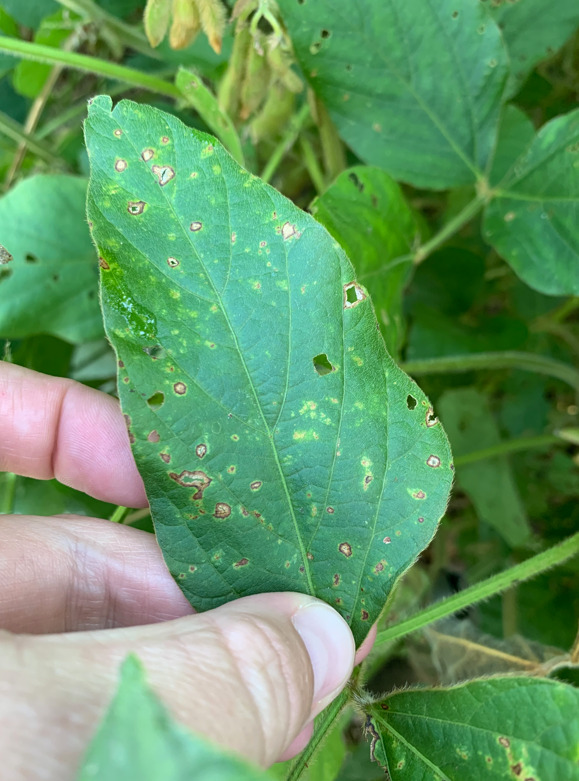
Figure 6. Frogeye leaf spot symptoms in foliar fungicide trial in Sampson county.
Below are the yield results for how the various fungicide products performed across and within the locations with varying environmental. There were no statistical differences between the fungicide application (combined across products) and the nontreated control across all locations (Figure 7). Though, within each environment Sampson did show that fungicide protected yield significantly compared to the nontreated check (Figure 8). There were no differences observed in Yadkin or Union (Figure 9 and10).
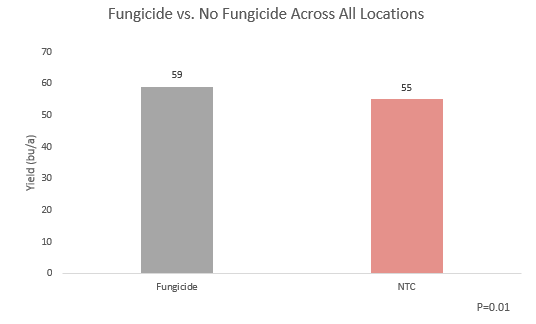
Figure 7. Effect of a fungicide on yield across all locations.
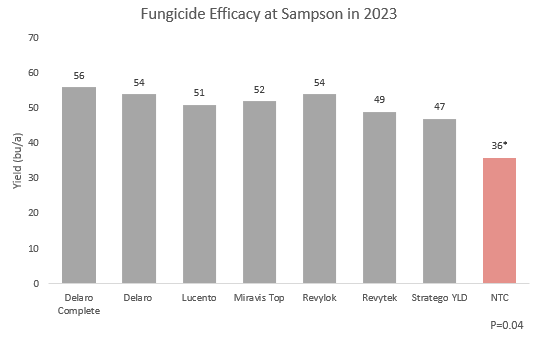
Figure 8. Effect of a fungicide on yield at Sampson County trial.
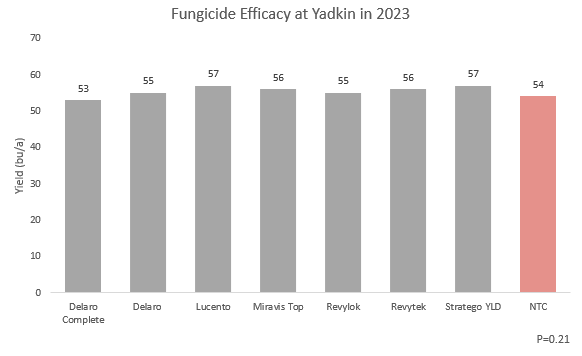
Figure 9. Effect of a fungicide on yield at Yadkin County trial.
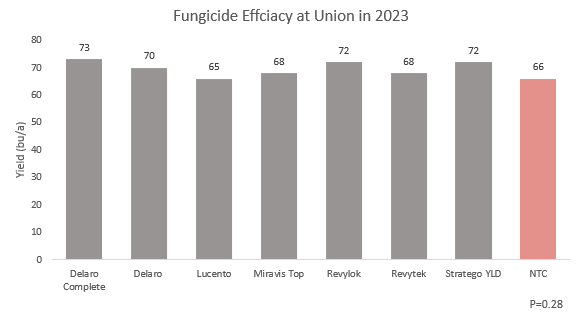
Figure 10. Effect of a fungicide on yield at Union County trial.